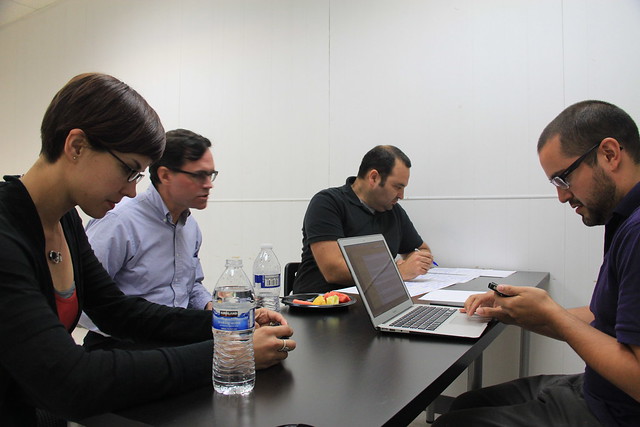
On May 11th, the City of Chicago and Google will host a Safe Communities Hackathon at Google’s Chicago office. (You can register for the free event here.) The team at Chicago’s Department of Innovation and Technology has just launched a new API based on the ClearMap System that will serve as great fodder for the hackathon and should lead to some interesting apps in the weeks and months to come.
Public crime data has a long history in Chicago, going back at least as far as the Citizen ICAM project in the early 90s. Adrian Holovaty’s broadly influential Chicago Crime website (which later was embedded in EveryBlock) was hot in the mid to late 00s.
When Brett Goldstein moved from the Chicago Police Department to his role as Chief Data Officer, he engineered the enormous publication (brought down Socrata w/ number of downloads!) of more than a decade of crime data. Great apps from great developers like Open City and the Chicago Tribune have built on this data, making it easier to see and understand these crime reports.
All of this is great stuff. But crime here is still a enormous issue. It tears a hole in the corpus of the city.
The newly minted API at http://api1.chicagopolice.org/clearpath/documentation (take a moment to consider that URL) is a great step in changing that. It has methods for querying crime, most wanted lists, and mug shots– data about what has already happened, much in the same vein of the tools and services created in the last decade or so.
But the beauty of this API is the “Community Concern” and “Community Event” elements. With the ability to submit and check a community concern, and see events where your neighbors are gathering to discuss safety, this API brings the Chicago Police Department back full circle. The first CLEARPath system was made as a corollary the nascent Chicago Alternative Policing Strategy, which was a new concept at the time.
I am signed up for the hackathon– I hope to see lots of people there. Meanwhile, here are some resources for the Safer Communities Hackathon created by Christopher Whitaker.
Data
Data provided by the City of Chicago
ClearPath REST API
The City of Chicago Police Department’s ClearPath website has been a leader in putting crime information online for years. Now that system has a brand new API. Below is a list of the API calls developers can pull up.
List of API Calls
- Community Concerns API Calls
- Create Community Concern
- Check Community Concern Status
- Crimes API Calls
- Crime Categories
- By Major Crimes
- Crimes Near XY Coordinates
- By Record Division Number
- By Type of Crime
- List of all Crimes
- Mugshots API Calls
- By Warrant Number
- Display Mugshot
- Most Wanted API Calls
- List of Most Wanted Individuals
- Community Events Calendar API Calls
- Get Community Events
- Get Community Events Calendars
City of Chicago Crime Data from 2001 to Present
All City of Chicago crime reports from 2001 to the present.
City of Chicago Hardship Index
“This dataset contains a selection of six socioeconomic indicators of public health significance and a “hardship index,” by Chicago community area, for the years 2006 – 2010. The indicators are the percent of occupied housing units with more than one person per room (i.e., crowded housing); the percent of households living below the federal poverty level; the percent of persons in the labor force over the age of 16 years that are unemployed; the percent of persons over the age of 25 years without a high school diploma; the percent of the population under 18 or over 64 years of age (i.e., dependency); and per capita income. Indicators for Chicago as a whole are provided in the final row of the table.”
Vacant and Abandoned Buildings as reported to 311
“All 311 calls for open and vacant buildings reported to the City of Chicago since January 1, 2010. The information is updated daily with the previous day’s calls added to the records. The data set provides the date of the 311 service request and the unique Service Request # attached to each request. For each request, the following information (as reported by the 311 caller) is available: address location of building; whether building is vacant or occupied; whether the building is open or boarded; entry point if building is open; whether non-residents are occupying or using the building, if the building appears dangerous or hazardous and if the building is vacant due to a fire.”
Vacant Abandoned Building Violations
“Vacant and abandoned building violations issued on properties owned by financial institutions since January 1, 2011. Each violation is tied to a Docket Number. A Docket may have more than one violation associated with it. Fees are assessed based on all violations associated with a particular Docket. This dataset displays the most recent action (disposition description) for each violation, the fees and fines associated with the docket and the amount paid or outstanding for the docket. If the docket is a City Non-Suit or the owner is found to be Not Liable, then no payment is required. Note that multiple addresses may be associated with a violation; in these cases, multiple records will be included in this dataset for a single violation. / Data Owners: Administrative Hearings / Finance / Time Period: January 1, 2011 to present / Update Frequency: Data is updated daily”
Police Stations
“Chicago Police district station locations and contact information.”
Police Beat Boundaries
“Current police beat boundaries in Chicago. The data can be viewed on the Chicago Data Portal with a web browser. However, to view or use the files outside of a web browser, you will need to use compression software and special GIS software, such as ESRI ArcGIS (shape file) or Google Earth (KML or KMZ), is required.”
Police District Boundaries
“KML files of police districts in Chicago. To view or use these files, special GIS software such as Google Earth is required.”
Chicago Police Department – Illinois Uniform Crime Reporting Codes
“Illinois Uniform Crime Reporting (IUCR) codes are four digit codes that law enforcement agencies use to classify criminal incidents when taking individual reports. These codes are also used to aggregate types of cases for statistical purposes. In Illinois, the Illinois State Police establish IUCR codes, but the agencies can add codes to suit their individual needs.”
311 Reports of Graffiti
All open graffiti removal requests made to 311 and all requests completed since January 1, 2011. The Department of Streets & Sanitation’s Graffiti Blasters crews offer a vandalism removal service to private property owners. Graffiti Blasters employ “blast” trucks that use baking soda under high water pressure to erase painted graffiti from brick, stone and other mineral surfaces. They also use paint trucks to cover graffiti on the remaining surfaces. Organizations and residents may report graffiti and request its removal. 311 sometimes receives duplicate requests for graffiti removal. Requests that have been labeled as Duplicates are in the same geographic area and have been entered into 311’s Customer Service Requests (CSR) system at around the same time as a previous request. Duplicate reports/requests are labeled as such in the Status field, as either “Open – Dup” or “Completed – Dup.” Data is updated daily.”
Police Overtime
“Employee overtime and supplemental earnings by month and year-to-date. Data Owner: Budget & Management. Time Period: January 2012 to present. Frequency: Data is updated monthly.” (I’ve created a view that takes the original data set and shows only Chicago Police Department overtime”
State of Illinois Data
Drug Arrest Data
The State of Illinois’ Statistical Analysis Center has drug arrest data from 1975-2009. It only breaks down this data by the Act in which the arrest occurred. So, marijuana is in one category, every other drug in another, needles in another, and drug paraphernalia in another.
Cook County Data
Public Defender Pending Cases for 2011 by Month, Type
Citizen gathered data
Cook County Jail Inmate Tracker API (Beta)
By the Supreme Chi-Town Coding Crew
This is Django app that tracks the population of Cook County Jail over time and summarizes trends. This app is in active development.
Schoolcuts.org Data
By Apples2Apples and the Open Data Instititute
One of the major concerns around school closing is regarding students safety as they go from their old school to the new school. Schoolcuts.org shows which schools are closing and which schools are receiving students.
Private company data sets
Forecast.io API
One of the conversations you’ll here in Chicago is that when the weather gets warm, the city gets violent. Given that, for forecast.io API from the Dark Sky company may be useful to developers for showing if that’s true or not. The first 10,000 API calls are free and after that each 10,000 calls are a $1 each.
Projects
WBEZ Gang Map
From WBEZ Chicago’s web site
“WBEZ reproduced the flat maps depicted in the latest volume ofThe Gang Book and placed them in a more interactive format online. For the maps to be useful, we needed them to be searchable or at least browsable in a way that other maps informed by public data are. While fact-checking the boundaries we were drawing in a Google map, we asked the Chicago Police Department to supply gang territory data in commonly-used digital mapping formats (e.g., KML files use by Google maps). The department did not fulfill that request. Eventually (after we involved the Illinois Attorney General’s Office), the department provided flat, non-interactive maps that resembled those published in The Gang Book. The map you see below attempts to follow the contours laid out in those files.”
Crime in Chicago (OpenCity Apps)
From OpenCity Apps
“Crime in Chicago is a data visualization by Open City that lets you explore crime trends in Chicago’s 50 wards. It was built using open data about Chicago crimes released by the Chicago Police Department.”
Crimestep (Beta)
By Nick Doiron
Crimestep shows crime stats along your walking route including percentage of violent crime and crime that happens between 12:38 and 6:38pm. (Application still in development).
Vacant and Abandoned Building Finder
From OpenCity Apps
“The Vacant and Abandoned Building Finder is a tool for helping people and organizations find buildings in Chicago that are not in use and potentially hazardous to the neighborhood around them.”
Go2School App (Still in production)
By Tom Kompare
(The Go2School app is an app that helps parents find directions to their child’s school. While the initial version doesn’t deal with crime, a feature that Tom is working on involved integrating the safe passage program into the app)
Chicago Homicide Watch
By Chicago Sun-Times
“Our goal is to tell the story of every murder in the city, so that together we might fight the tendency to view homicides as just another rising or falling number, like mortgage rates or batting averages.”
Crime in Chicago (Chicago Tribune)
From the TribApps Team
“Find out about crime on your block, in your community, along your commute, and more.”
RedEye’s Homicide Map of Chicago
From RedEye Chicago
“Tracking homicides in Chicago is an ongoing project of the RedEye. This site is updated regularly with information from the Cook County Medical Examiner’s Office, the Chicago Police Department and the Chicago Breaking News Center. Information is subject to change. Data points appear Thursdays in RedEye’s print edition.”
2012 Chicago Murders Map & Timeline
By DNAinfo.com Chicago
“DNAinfo.com Chicago tracked every murder in Chicago in 2012 in an effort to show the human toll of violence in the city”
Articles
This reading list isn’t comprehensive or complete – but a good starting point in terms of thinking about these issues.
WBEZ
This American Life
Harper High School, Part One (Audio)
“We spent five months at Harper High School in Chicago, where last year alone 29 current and recent students were shot. 29. We went to get a sense of what it means to live in the midst of all this gun violence, how teens and adults navigate a world of funerals and Homecoming dances.”
Harper High School, Part Two
“We pick up where we left off last week in our second hour from Harper High School in Chicago. We find out if a shooting in the neighborhood will derail the school’s Homecoming game and dance. We hear the origin story of one of Harper’s gangs. And we ask a group of teenagers: where do you get your guns?”
WBEZ News
Report links Chicagoans’ distance from trauma centers to higher mortality rates, 4/18/2013, Natalie Moore
Kenwood residents react to policing policies, 1/13/2013, Natalie Moore
Chicago Tribune
Crime in Chicago’s vacant property soars 48% since 2005, 4/30/2013, Mary Ellen Podmolik
Timeline of a gun sale, 2/18/2013, Annie Sweeney, Ryan Nagle, and David Eads
Chicago Magazine
Gawker Glosses Chicago’s Murder Problem, 8/14/2012, Whet Moser
Chicago’s Criminals Are Getting Away With Murder, 5/2013, Noah Isackson
Chicago Reader
Concentrated Poverty and Homicide in Chicago, 7/26/2012, Steve Bogira
The speech Obama should give in Chicago, 2/14/2013, Steve Bogira
Are we missing something? Hit us up in the comments.
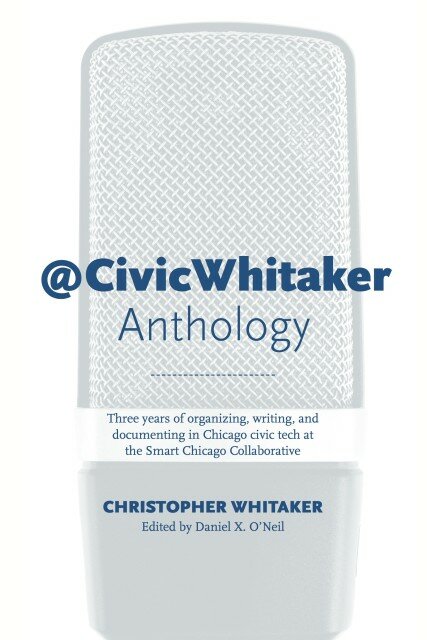 Today marks the publication of The @CivicWhitaker Anthology: Three years of organizing, writing, and documenting in Chicago civic tech at the Smart Chicago Collaborative. Here’s my introduction:


