State of Illinois Eliminate the Digital Divide Grants

Here is a handy spreadsheet of all Eliminate the Digital Divide grants going back to the inception of the program, showing all grants, grants by year (2007 – 2012), all Chicago grants, and all Chicago grants by year. All of this data is  pulled from http://granttracker.ildceo.net/. You can also knock around with the data in this custom view on the State’s data portal.

Here’s a breakdown:

ALL GRANTS STATEWIDE

Year | # of grants | Avg. amount of grants

2007 | 16 | $756,156 $47,260

2008 | 103 | $5,060,661 $49,133

2009 | 91 | $5,079,129 $55,815

2010 | 101  | $4,944,877 $48,959

2011 | 124 | $5,065,137 $40,848

2012 | 88 | $4,102,117 $46,615

TOTALS” 523 grants for a total of $25,008,077 with an average grant of $48,105.

ALL GRANTS IN CHICAGO

Year | # of grants | Avg. amount of grants

2007 | 11 | $460,505 $41,864

2008 | 60 | $3,327,602 $55,460

2009 | 59 | $3,303,522 $55,992

2010 | 60 | $2,519,574 $41,993

2011 | 66 | $2,728,243 $41,337

2012 | 50 | $2,228,595 $44,572

TOTALS:  306 grants for a total of $14,568,041 with an average grant of $46,870.


Join us for the National Day of Civic Hacking in Chicago

On May 31st – June 3rd, Chicago will have three separate events in coordination with the National Day of Civic Hacking.

National Day of Civic Hacking is a nationwide effort being coordinated by Random Hacks of Kindness, Code for America and the White House to help organize civic minded developers, designers, writers, and data scientists help create innovative solutions to civic problems.


This day— the first of its kind in the nation— has been a long time in coming. Back in January, I wrote about what it takes to turn civic hacking into civic innovation. Here’s a snip:

The civic hacking community in Chicago has produced a variety of civic web applications based on open data provided by local government here in Chicago. These apps do things like show economic indicators in fun ways, let you know if your car was towed, and how & where to get a flu shot.

There are lots of reasons why civic hacking works here in Chicago— a rich baseline of data and technology, an engaged developer community, real discussions with government about policy and data, and the support of institutions are all important factors.

But what we’re missing most is sustained engagement with the residents of the city of Chicago. That’s how we can turn mere hacking into real innovation. The magic combination of government, developers, and community members is what we’re after.

So that’s our focus here in Chicago. While cities across the nation participate in the essential baseline tasks of civic hacking, we’ll be tackling this broader work, seeking to expand the movement we’ve built.

It’s time for all Chicagoans to “meet the movement”– to work hand-in-hand with hackers in order to make our communities better. We hope you’ll join us. Here’s a list of events:

ChicagoMigrahack at Cibola (May 31st – June 2nd)

The purpose of Chicago Migrahack is to foster the use of technology and open data to innovate information around immigration. In Spanish, the word “migra” refers to immigration.

We want to bring together our communities to create innovative platforms around one of the most debated topics today: Immigration

This event will kick off Friday, May 31st with a day of training around civic hacking and data. There will be $7,000 in cash prizes given away for the best projects.

Civic Hack Day for Youth at Adler Planetarium

Image courtesy of Greg Briggs – Creative Commons License

The Adler Planetarium is holding a youth-focussed Civic Hack Day on June 1/2 where Chicago youth, mentors, and highly skilled STEM professionals will work together in teams towards solutions to Chicago Issues. Youth team members will bring problems with them that they, or members of their communities, face on a daily basis, as well as a vision for a technological solution. This unique, youth-focused event is being run in collaboration with the Hive Chicago, Mikva Challenge, the Chicago Architecture Foundation and Free Spirit Media Working. Young people, their mentors and STEM professionals will shape and build working prototypes of their solutions over an awe-inspiring 28-hour period.

Hack for Chicago at 1871 (June 1st)

We’ll be having several different events at 1871 during the weekend. You can register for these events here.

App Design Workshop with the Knight Lab

Miranda Mulligan from the Knight Lab will give a workshop on designing apps that meet the needs of users.

National Civic Hacking 101 Workshop with Code for America

Christopher Whitaker will give a short primer on civic hacking to help orient people who are new to hackathons and civic innovation. This class will be broadcast nationwide in cooperation with other cities.

OpenStreetMap Edit-a-thon with Ian Dees

OpenStreetMap is an open source map that anyone can edit. Users can add data to the map including information about their favorite restaurants, cultural venues, and more. We’ll be adding more data to the map all weekend long. You can register for the event at the Chicago OpenStreetMap Meetup Page here.

General Hack Session with OpenCity Apps

We’ll also be having a general hack session if you’re already working on a civic app.

We’ll be sending more information about the event as time gets closer. Look forward to seeing you at one of the events!

PRESS

Here’s some coverage of the event.

Chicagoan’s prep for massive civic hacakthon
WBEZ Datum blog

Chicago: City of Big Data and National Day of Civic Hacking
Code for America Blog

Join the CUTGroup and Take Part in Test of a Travel-to-School Website

We’re organizing a test of a web site that allows you to explore travel options to your Chicago Public School.

If you meet the following requirements, you qualify to be in the test, receive a $20 VISA gift card + bus fare, and help make better software for Chicago!

  • Responsible for taking one or more kid to a Chicago public school this Fall
  • Available on the evenings of Tuesday, May 28 or Thursday, May 30

If you’re already in the CUTGroup, you’ve already received an email to this effect. Otherwise, sign up now, get a mitt, get in the game, and get some money.

CUTGroup as of May 5, 2013

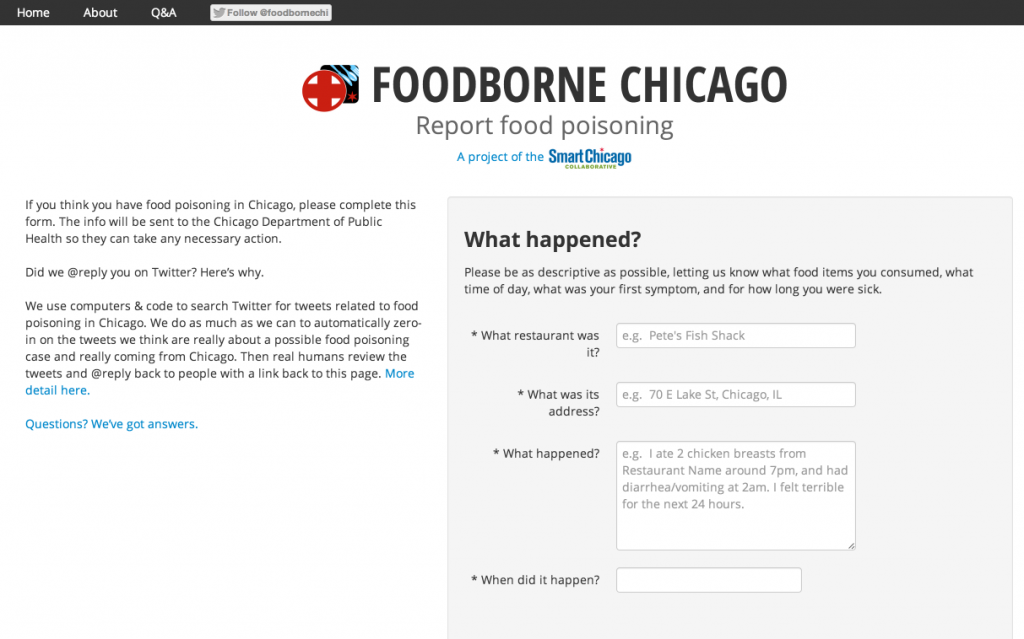
Foodborne Chicago on WBEZ Chicago

Yesterday morning I talked with Tony Sarabia of the WBEZ Morning Shift about Foodborne Chicago. Here’s the sound. Listen all the way to the end for a pretty wacky bumper tune.

Key points covered:

  • This site is not about making a cool app. It’s about making teeny tiny connections between the people who matter: residents of the City of Chicago and the municipal government that serves them
  • Chicago’s Open 311 system (funded and supported by Smart Chicago) provides the technological and conceptual basis for this site. Without the ability to write directly to the City’s 311 system, and thereby get into the Chicago Department of Public Health’s normal workflow for dealing with food safety, Foodborne Chicago wouldn’t exist
  • Twitter and other social media is fast becoming important in all sorts of human domains, including health. There are one million health tweets per day and users tweet symptoms 4 days before seeing a doctor. See more here in this presentation out of Johns Hopkins University: Social Media: New Data Source for Public Health

Foodborne Chicago - Report incidents of food poisoning in Chicago

The Chicago Police API, Safer Communities Hackathon, and Huge List of Chicago Crime Data Resources

Who will watch the watchmen? Reed!

On May 11th, the City of Chicago and Google will host a Safe Communities Hackathon at Google’s Chicago office. (You can register for the free event here.) The team at Chicago’s Department of Innovation and Technology has just launched a new API based on the ClearMap System that will serve as great fodder for the hackathon and should lead to some interesting apps in the weeks and months to come.

Public crime data has a long history in Chicago, going back at least as far as the Citizen ICAM project in the early 90s. Adrian Holovaty’s broadly influential Chicago Crime website (which later was embedded in EveryBlock) was hot in the mid to late 00s.

When Brett Goldstein moved from the Chicago Police Department to his role as Chief Data Officer, he engineered the enormous publication (brought down Socrata w/ number of downloads!) of more than a decade of crime data. Great apps from great developers like Open City and the Chicago Tribune have built on this data, making it easier to see and understand these crime reports.

All of this is great stuff. But crime here is still a enormous issue. It tears a hole in the corpus of the city. 

The newly minted API at http://api1.chicagopolice.org/clearpath/documentation (take a moment to consider that URL) is a great step in changing that. It has methods for querying crime, most wanted lists, and mug shots– data about what has already happened, much in the same vein of the tools and services created in the last decade or so.

But the beauty of this API is the “Community Concern” and “Community Event” elements. With the ability to submit and check a community concern, and see events where your neighbors are gathering to discuss safety, this API brings the Chicago Police Department back full circle. The first CLEARPath system was made as a corollary the nascent Chicago Alternative Policing Strategy, which was a new concept at the time.

I am signed up for the hackathon– I hope to see lots of people there. Meanwhile, here are some resources for the Safer Communities Hackathon created by Christopher Whitaker.

Data

Data provided by the City of Chicago

ClearPath REST API

The City of Chicago Police Department’s ClearPath website has been a leader in putting crime information online for years. Now that system has a brand new API. Below is a list of the API calls developers can pull up.

List of API Calls

  • Community Concerns API Calls
    • Create Community Concern
    • Check Community Concern Status
  • Crimes API Calls
    • Crime Categories
    • By Major Crimes
    • Crimes Near XY Coordinates
    • By Record Division Number
    • By Type of Crime
    • List of all Crimes
  • Mugshots API Calls
    • By Warrant Number
    • Display Mugshot
  • Most Wanted API Calls
    • List of Most Wanted Individuals
  • Community Events Calendar API Calls
    • Get Community Events
    • Get Community Events Calendars

City of Chicago Crime Data from 2001 to Present

All City of Chicago crime reports from 2001 to the present.

City of Chicago Hardship Index

“This dataset contains a selection of six socioeconomic indicators of public health significance and a “hardship index,” by Chicago community area, for the years 2006 – 2010. The indicators are the percent of occupied housing units with more than one person per room (i.e., crowded housing); the percent of households living below the federal poverty level; the percent of persons in the labor force over the age of 16 years that are unemployed; the percent of persons over the age of 25 years without a high school diploma; the percent of the population under 18 or over 64 years of age (i.e., dependency); and per capita income. Indicators for Chicago as a whole are provided in the final row of the table.”

Vacant and Abandoned Buildings as reported to 311

“All 311 calls for open and vacant buildings reported to the City of Chicago since January 1, 2010. The information is updated daily with the previous day’s calls added to the records. The data set provides the date of the 311 service request and the unique Service Request # attached to each request. For each request, the following information (as reported by the 311 caller) is available: address location of building; whether building is vacant or occupied; whether the building is open or boarded; entry point if building is open; whether non-residents are occupying or using the building, if the building appears dangerous or hazardous and if the building is vacant due to a fire.”

Vacant Abandoned Building Violations

“Vacant and abandoned building violations issued on properties owned by financial institutions since January 1, 2011. Each violation is tied to a Docket Number. A Docket may have more than one violation associated with it. Fees are assessed based on all violations associated with a particular Docket. This dataset displays the most recent action (disposition description) for each violation, the fees and fines associated with the docket and the amount paid or outstanding for the docket. If the docket is a City Non-Suit or the owner is found to be Not Liable, then no payment is required. Note that multiple addresses may be associated with a violation; in these cases, multiple records will be included in this dataset for a single violation. / Data Owners: Administrative Hearings / Finance / Time Period: January 1, 2011 to present / Update Frequency: Data is updated daily”

Police Stations

“Chicago Police district station locations and contact information.”

Police Beat Boundaries

“Current police beat boundaries in Chicago. The data can be viewed on the Chicago Data Portal with a web browser. However, to view or use the files outside of a web browser, you will need to use compression software and special GIS software, such as ESRI ArcGIS (shape file) or Google Earth (KML or KMZ), is required.”

Police District Boundaries

“KML files of police districts in Chicago. To view or use these files, special GIS software such as Google Earth is required.”

Chicago Police Department – Illinois Uniform Crime Reporting Codes

“Illinois Uniform Crime Reporting (IUCR) codes are four digit codes that law enforcement agencies use to classify criminal incidents when taking individual reports. These codes are also used to aggregate types of cases for statistical purposes. In Illinois, the Illinois State Police establish IUCR codes, but the agencies can add codes to suit their individual needs.”
311 Reports of Graffiti

All open graffiti removal requests made to 311 and all requests completed since January 1, 2011. The Department of Streets & Sanitation’s Graffiti Blasters crews offer a vandalism removal service to private property owners. Graffiti Blasters employ “blast” trucks that use baking soda under high water pressure to erase painted graffiti from brick, stone and other mineral surfaces. They also use paint trucks to cover graffiti on the remaining surfaces. Organizations and residents may report graffiti and request its removal. 311 sometimes receives duplicate requests for graffiti removal. Requests that have been labeled as Duplicates are in the same geographic area and have been entered into 311’s Customer Service Requests (CSR) system at around the same time as a previous request. Duplicate reports/requests are labeled as such in the Status field, as either “Open – Dup” or “Completed – Dup.” Data is updated daily.”

Police Overtime

“Employee overtime and supplemental earnings by month and year-to-date. Data Owner: Budget & Management. Time Period: January 2012 to present. Frequency: Data is updated monthly.” (I’ve created a view that takes the original data set and shows only Chicago Police Department overtime”

State of Illinois Data

Drug Arrest Data

The State of Illinois’ Statistical Analysis Center has drug arrest data from 1975-2009. It only breaks down this data by the Act in which the arrest occurred. So, marijuana is in one category, every other drug in another, needles in another, and drug paraphernalia in another.

Cook County Data

Public Defender Pending Cases for 2011 by Month, Type

Citizen gathered data

Cook County Jail Inmate Tracker API (Beta)

By the Supreme Chi-Town Coding Crew

This is Django app that tracks the population of Cook County Jail over time and summarizes trends. This app is in active development.

Schoolcuts.org Data

By Apples2Apples and the Open Data Instititute

One of the major concerns around school closing is regarding students safety as they go from their old school to the new school. Schoolcuts.org shows which schools are closing and which schools are receiving students.

Private company data sets

Forecast.io API

One of the conversations you’ll here in Chicago is that when the weather gets warm, the city gets violent. Given that, for forecast.io API from the Dark Sky company may be useful to developers for showing if that’s true or not. The first 10,000 API calls are free and after that each 10,000 calls are a $1 each.

Projects

WBEZ Gang Map

From WBEZ Chicago’s web site

“WBEZ reproduced the flat maps depicted in the latest volume ofThe Gang Book and placed them in a more interactive format online. For the maps to be useful, we needed them to be searchable or at least browsable in a way that other maps informed by public data are. While fact-checking the boundaries we were drawing in a Google map, we asked the Chicago Police Department to supply gang territory data in commonly-used digital mapping formats (e.g., KML files use by Google maps). The department did not fulfill that request. Eventually (after we involved the Illinois Attorney General’s Office), the department provided flat, non-interactive maps that resembled those published in The Gang Book. The map you see below attempts to follow the contours laid out in those files.”

Crime in Chicago (OpenCity Apps)

From OpenCity Apps

“Crime in Chicago is a data visualization by Open City that lets you explore crime trends in Chicago’s 50 wards. It was built using open data about Chicago crimes released by the Chicago Police Department.”

Crimestep (Beta)

By Nick Doiron

Crimestep shows crime stats along your walking route including percentage of violent crime and crime that happens between 12:38 and 6:38pm. (Application still in development).

Vacant and Abandoned Building Finder

From OpenCity Apps

“The Vacant and Abandoned Building Finder is a tool for helping people and organizations find buildings in Chicago that are not in use and potentially hazardous to the neighborhood around them.”

Go2School App (Still in production)

By Tom Kompare

(The Go2School app is an app that helps parents find directions to their child’s school. While the initial version doesn’t deal with crime, a feature that Tom is working on involved integrating the safe passage program into the app)

Chicago Homicide Watch

By Chicago Sun-Times

“Our goal is to tell the story of every murder in the city, so that together we might fight the tendency to view homicides as just another rising or falling number, like mortgage rates or batting averages.”

Crime in Chicago (Chicago Tribune)

From the TribApps Team

“Find out about crime on your block, in your community, along your commute, and more.”

RedEye’s Homicide Map of Chicago

From RedEye Chicago

“Tracking homicides in Chicago is an ongoing project of the RedEye. This site is updated regularly with information from the Cook County Medical Examiner’s Office, the Chicago Police Department and the Chicago Breaking News Center. Information is subject to change. Data points appear Thursdays in RedEye’s print edition.”

2012 Chicago Murders Map & Timeline

By DNAinfo.com Chicago

“DNAinfo.com Chicago tracked every murder in Chicago in 2012 in an effort to show the human toll of violence in the city”

Articles

This reading list isn’t comprehensive or complete – but a good starting point in terms of thinking about these issues.

WBEZ

This American Life

Harper High School, Part One (Audio)

“We spent five months at Harper High School in Chicago, where last year alone 29 current and recent students were shot. 29. We went to get a sense of what it means to live in the midst of all this gun violence, how teens and adults navigate a world of funerals and Homecoming dances.”

Harper High School, Part Two

“We pick up where we left off last week in our second hour from Harper High School in Chicago. We find out if a shooting in the neighborhood will derail the school’s Homecoming game and dance. We hear the origin story of one of Harper’s gangs. And we ask a group of teenagers: where do you get your guns?”

WBEZ News

Report links Chicagoans’ distance from trauma centers to higher mortality rates, 4/18/2013, Natalie Moore

Kenwood residents react to policing policies, 1/13/2013, Natalie Moore

Chicago Tribune

Crime in Chicago’s vacant property soars 48% since 2005, 4/30/2013, Mary Ellen Podmolik

Timeline of a gun sale, 2/18/2013, Annie Sweeney, Ryan Nagle, and David Eads

Chicago Magazine

Gawker Glosses Chicago’s Murder Problem, 8/14/2012, Whet Moser

Chicago’s Criminals Are Getting Away With Murder, 5/2013, Noah Isackson

Chicago Reader

Concentrated Poverty and Homicide in Chicago, 7/26/2012, Steve Bogira

The speech Obama should give in Chicago, 2/14/2013, Steve Bogira

Are we missing something? Hit us up in the comments.
Road to Government 2.0: Projects and Publications Around Analytics & Technology

Road to Government 2.0: Technological Problems and Solutions for Transparency, Efficiency and Participation

Last year I (along with Brett Goldstein, Chief Data Officer and Chief Information Officer for the City of Chicago) participated in the FOCAS 2012: Towards Open and Innovative Governance conference run by the Communications and Society Program run by the Aspen Institute. They recently published this report based on that conference: Road to Government 2.0: Technological Problems and Solutions for Transparency, Efficiency and Participation. Here’s a PDF of the publication and a relevant snip from the portion I worked on:

Solution 4: Alert System

Even with a heavy media push, many government services may slip by citizens, especially the underprivileged. The problem is, “I do not know what public information and services are available to me when I need and want them,” suggested Caitria O’Neill.

Speaking for another FOCAS working group, O’Neill proposed an opt-in government alert system that would signal citizens as they encounter opportunities for government services, such as moving to a different address. Such a system could also prevent duplicating government services and save on wasted advertising spending. The geolocation-sensitive system would be built out in three phases.

Phase 1: Build a framework for the system. The (very) specific checklist for the framework includes: “A large distributed NoSQL architecture that is cloud-based, that is able to answer spatially relevant queries via a RESTful API,” and that is powered by a combination of tools, such as Hadoop, MongoDB and PostGIS. Governmental and nongovernmental data sources can populate the system, and the team recommends public-private partnerships to maximize the available sources.

Phase 2: Develop and gather information about users, what they might use the information for, and what they need. “Units of government gather information about the consumption of services all the time in the normal course of business. They track things like who is obtaining business licenses and for what purpose, who has a driver’s license, who receives a particular benefit, and so on. There’s nothing new about this and no new systems need be made,” suggested Smart Chicago Collaborative Executive Director Daniel O’Neil.

Phase 3: Marketing. The group preferred that the government provide the service but that it be an open platform for others to offer apps to citizens and consumers. They argued that a private-sector solution “will likely not be provided for free or with the same level of integrity.” Thus they suggested the platform begin with government and foundation funding, as a fee-for-service solution is unlikely to be developed unless the government acts first.

Precautions must be made as to who governs the data and how active the government will be in targeting and advertising to citizens.

This overall concept fits into much of the work Brett has been leading here in Chicago, including the Chicago SmartData Platform, which won $1 million from the Bloomberg Philanthropies Mayors Challenge.

Elliot Ramos of WBEZ did a pretty good job of pulling the City’s various projects together in this post: City tech wonks add toys to Emanuel’s utility belt (disclosure: WBEZ is a grantee of the Chicago Community Trust under the Civic Innovation in Chicago project). Here’s a hefty snip:

While there, Goldstein touted several projects his department has initiated. Many were in testing stages, amounting to Chicago’s own version of Google Labs.

Within the the walls of the Daley Center, Goldstein’s department creates tools, utilizing the mountains of data to inform city managers about the inner workings of the city — sometimes in real time.

The project names are whimsical, but their use could very well alter the way city departments respond with services, perhaps pre-emptively.

Among the tools: Project Unicorn, which was recently renamed Chirp, on a submission to the Knight News Challenge. The city seeks to use that program “to act on city service issues identified via social media — eliminating the need to visit City Hall, call 311, or download special applications,” according to the project submission.

The tool, currently being tested by Goldstein’s department, would allow the city to monitor location-based Tweets and then respond to requests such as street-light outages or graffiti removal.

The city’s also testing Project Falcon, renamed on another submission to the Knight News Challenge as Scout.

About the grant submission, Goldstein said Scout would “aggregate data sources based on location … Applications built using this interface will enable residents to interact with data in a way that’s structured around their day-to-day lives.”

This is above and beyond the SmartData Platform, a separate program developed with funds from the Bloomberg Mayors’ Challenge, according to a spokesperson from Goldstein’s department. The platform’s purpose is allow City Hall to analyze millions of lines of data in real-time and, according to the city, make “smarter, earlier decisions to address a wide range of urban challenges.” The city won $1-million prize from Bloomberg Philanthropies to spend on the project.

Another effort aims to better visualize data using unconventional techniques. This one, dubbedProject Batman, will utilize an immersive, multi-display system called “The Cave.”

The Cave, housed at the University of Illinois at Chicago, has already been used by researchers to visualize environments or biological models.

The display is reminiscent of the computer used by Tom Cruise’s character Chief John Anderton in the 2002 movie Minority Report. That movie is often cited for its near prescience in predictingthe touch-and-swipe interfaces common to iPhones and iPads.

Smart Chicago is deeply interested in helping our founding partner, the City of Chicago move forward on these topics as we execute on our own projects like FoodborneChicago.

An open source admin tool for fusion tables

Smart Chicago’s Connect Chicago campaign is part of the federal Broadband Technology Opportunities Program. Smart Chicago has helped administer millions of dollars of these funds in programs for its partner, the City of Chicago.

The Connect Chicago location tool tool is a Ruby on Rails app that powers the map and detail page section of our site.


Origins

As part of this project, we hired Chicago developer Derek Eder, who has also worked on other Smart Chicago Collaborative since July 2012. The Connect Chicago Locator originated from Derek’s open source Searchable Map Template. It is powered by the free Google Fusion Tables service that lets you take spreadsheets of data and turn them into maps and other visualizations. His template, which can run on any web server, connects to your Fusion Table, reads in the data, and displays a searchable, filterable map. This template is super-useful and has been used by organizations like the City of Chicago, Chicago Public Schools, and the Chicago Tribune to get map-based sets up and running quickly.

The issue with the Searchable Map Template in the context of this project was that once the map is published, the only way to update it is to directly change the underlying Fusion Table through Google’s interface.

At Connect Chicago, we cover more that 250 places where you can use a computer for free, and it’s important that people in each of these locations (librarians, computer lab managers, social services agency leads, and so on) be able to update their detail page easily.

With an admin tool, managers at each location could update its own detail page with images, tables, contact info and transit directions. As far as we can tell know, no one has made a tool like this for Fusion Tables before.

We also knew that this general idea– the ability for non-technical people to update a robust web map with updated information– was broadly useful to Chicagoans. All of the code for this tool, including the underlying admin module, is available in this package.

One nice feature that I wanted in there, based on my long-term love for Flickr (30,000+ Creative Commons photos posted over nearly a decade): all photos on the detail pages are pulled from Flickr using system-generated unique tags. For example, here’s a bunch of photos I took of the Merlo Library on Belmont and tagged with “pcc-merlo-157 “).

Here’s some technical details from Derek about how we got this done:

The fusion_tables gem

The piece of technology that made these advanced features possible was the fusion_tables gem by Simon Tokumine. This gem, or code library, acts as an interface to read and write data to Fusion Tables from a Ruby application. It sounds simple, but in fact, adds a huge amount of power and convenience for building websites that interact with Fusion Tables. With this gem, we were able to fetch a row based on a URL and populate a detail page with the information. 

Here’s a snippet of how it works (viewing the Connect Chicago Fusion Table alongside will help):

#initialize Fusion Tables API
FT = GData::Client::FusionTables.new      
FT.clientlogin(APP_CONFIG['google_account'], APP_CONFIG['google_password'])
FT.set_api_key(APP_CONFIG['google_api_key'])

@location = FT.execute("SELECT * FROM 
1xy_wp4-NhtKPecuDlhsS8MLO0z-g5ayY1OfBhAg WHERE slug = 
‘roosevelt-library-1101-w-taylor-street';").first

From there, we have a handle on this @location object, and I can access different attributes like:

@location[:organization_name] # returns ‘Roosevelt Library’
@location[:address] # returns ‘1101 W. Taylor St’

Ruby on Rails Active Model framework

Now that we had an easy way to dynamically read data from our Fusion Table, we needed to give our site administrators some way to edit their data. On any web form, you want to make sure that the information people are entering is correct and what you expect. Form validation is the way to do this. Because we were using Ruby on Rails 3, we were able to leverage their powerful Active Model framework to handle it.

Active Model allows you to extend the non-database functionality of Active Record (an Object Relational Mapper) to any object. Remember our @location object we got from our fusion_tables gem? That is just a simple list of attributes and values (otherwise known as a Hash). By using Active Model, however, we can treat it like an Active Record object and get our form validation for free!

Inside the locations_controller:

@location = Location.new(location_edit)
if @location.valid?
   # save our data
else
   # oops! didn’t validate, take them back to the edit page
end

And here’s our location model:

class Location
  include ActiveModel::Validations
  include ActiveModel::Conversion
  extend ActiveModel::Naming

  # this line tells ActiveModel to make sure that orgainzation_name and others aren’t empty when validation is called
  validates_presence_of :organization_name, :organization_type, :org_phone, :address, :city, :state, :zip_code

  def create_method( name, &block )
    self.class.send( :define_method, name, &block )
  end

  def create_attr( name )
    create_method( "#{name}=".to_sym ) { |val| 
      instance_variable_set( "@" + name, val)
    }

    create_method( name.to_sym ) { 
      instance_variable_get( "@" + name ) 
    }
  end

  def initialize(attributes = {})
    #read in a hash of attributes from Fusion Tables and set them as attributes of the model
    #for more, see http://railscasts.com/episodes/219-active-model
    attributes.each do |name, value|
      name = "#{name}"
      create_attr name
      send("#{name}=", value)
    end
  end

  def persisted?
    false
  end
end

Advancing the utility of a useful tool

From here on out, if you need a Searchable Map Template with an easy-to-use admin tool for distributed detail page authorship, use the Connect Chicago Locator Tool. We look forward to seeing what comes of this!


Two OpenStreetMap Events

One of the main objectives of Smart Chicago is to help build the infrastructure of civic innovation in Chicago. That’s why we publish so much open source code, host so many apps, and support so many events.

Since so much of  civic innovation relates to place, there’s nothing more infrastructural than the maps upon which we publish information. That’s why we’re stoked to support Ian Dees and the work that he & others are doing around OpenStreetMap.

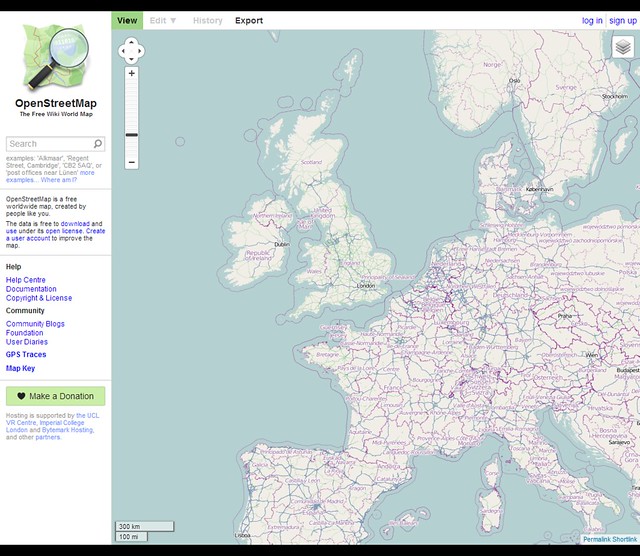
OpenStreetMap is the wiki-style map of the world. Just like Wikipedia, you can add or change any part of the map, making it better for the community around you. In Chicago, the map is particularly detailed thanks to help from many dedicated mappers and data released by the city. The more people contribute, the better the map will get.

OpenStreetMap

April is a busy OpenStreetMap month in Chicago. They are putting together two exciting weekends of events that we’re supporting along with our partner, Knight-Mozilla OpenNews: the Map-a-Thon and Hack Weekends.

OpenStreetMap Map-a-Thon

Beginning mappers are invited to be a part of a national OpenStreetMap Map-a-thon by learning how to use our tools to improve the map in your area. You can add your favorite restaurant or comic book store, a local school or hospital. During the map-a-thon we’ll walk you through the process of finding your area, creating an account, and making your first edit. With that foundation, you can go on to make an impact by adding tons of information relevant to you and your community!

Attend the Map-a-thon April 20th and 21st at 1871 on the 12th floor of the Merchandise Mart, 222 Merchandise Mart Plaza from noon to 6pm. Participants will enjoy food and drinks thanks to Smart Chicago Collaborative.

For more information about the map-a-thon and to RSVP, please visit the Meetup page for the event.

OpenStreetMap Hack Weekend

If you know your way around a compiler, feel comfortable with JSON and XML, or know the difference between an ellipsoid and a geoid, then the Hack Weekend is for you. We’re looking for those with technical know-how to help make a difference in OpenStreetMap’s core software by writing patches and new software to help make mapping faster and easier. Special thanks to Knight-Mozilla OpenNews for their support and sponsorship.

The hack weekend will be held April 26th and 28th at 1871 from 9am to dinner time each day.

For more information about the hack weekend, please visit the OSM wiki page for the event.

Some Blurbs on the Last Week of January, 2013

Here’s some new Smart Chicago items from the last week or so:

The launch of the Civic User Testing Group

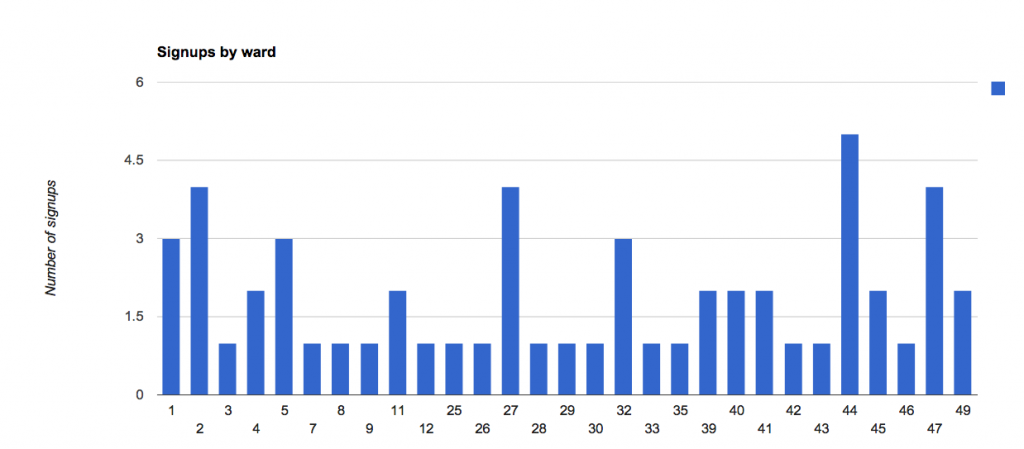
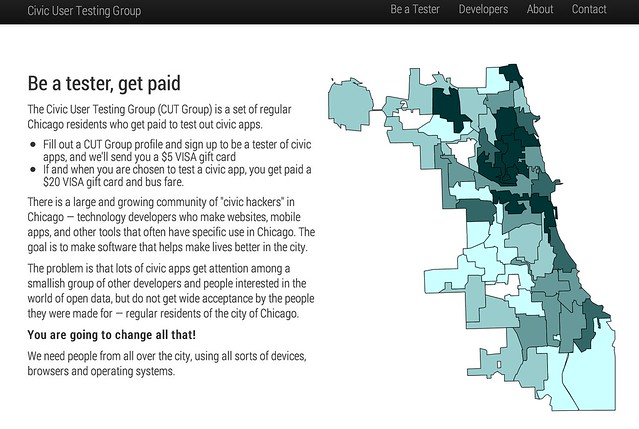
Last Friday we started the CUT Group, where regular Chicago residents get paid to test civic apps. Here’s a pretty good take on the nascent program from Michael Lipkin at WTTW: Civic Hackers Want You. We’ve had a pretty good response— 54 signups from 29 wards.

Screen Shot 2013-02-05 at 5.40.28 PM

Launch of the Illinois Open Technology Challenge

Last Friday we helped launch the Illinois Open Technology Challenge, There are five $15,000 prizes, for a total of $75,000. There will be winners from each of the four pilot communities (Champaign, Rockford, Belleville, and the south suburbs of Chicago) as well as one prize for the use of statewide data.

Mobile Dev Day at U of I

Last week was Mobile Development Day sponsored by the Research Park at the University of Illinois. Great event with lots of interesting speakers and panels. I got a lot out of one panel that helped you think out platform choice (iOS, Android, Web). I wrote a talk on the importance of mobile in urban flow, below.

Cook County New Media Council

Cook County Board President Toni Preckwinkle announced the Cook County New Media Council. Along with Blagica Bottigliero, I am co-chairing the council, whose goal is “to develop a digital strategy to better engage, serve, and connect with the public”. I expect great things here!